Hypothesis Testing
Hypothesis testing the mathematical way of saying "We have enough statistical evidence to say this statement is true".
At its core, hypothesis testing is a statistical method used to determine whether there is enough evidence in a sample of data to infer that a certain condition holds true for an entire population.
Step by step process
1. Setting up the hypothesis
Every test require two hypothesis to be defined.
- Null Hypothesis () This hypothesis says nothing changed, no effect happened, everything is as it was before.
- Alternative Hypothesis ( or ) This is the actual hypothesis you trying to prove. This says the thing has changed, there is a effect, it is different from what it was before.
Example: You did a marketing campaign for a restaurant.
- : The campaign did not increase sales ().
- : The campaign increased sales ().
Testing the Alternative hypothesis () is Difficult. But testing the Null Hypothesis () is not difficult comparing to Alternative hypothesis. So instead of testing , we test and use to support that if hypothesis is correct.
2. Declaring Rejection threshold
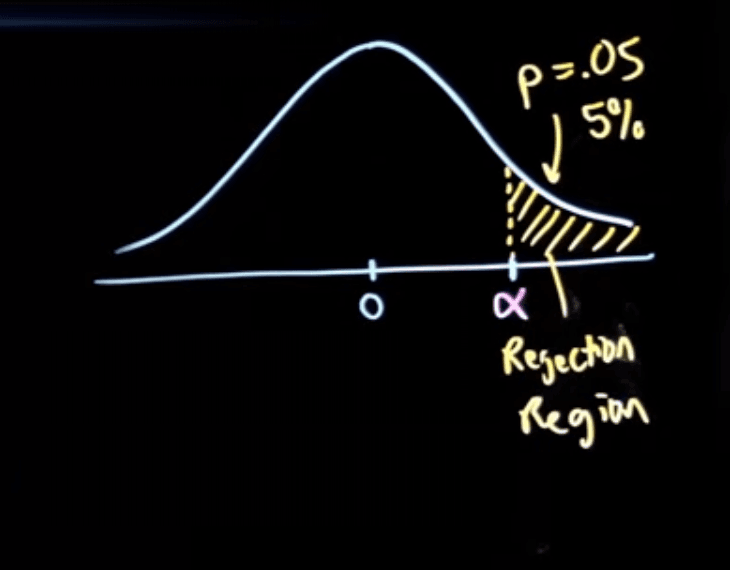
This threshold is known as the Significance level ().
Before looking at the data, we decide how strong the evidence must be to reject . This threshold is called the **significance level ()
- Standard practice sets ().
- This means you are willing to accept a risk of wrongly rejecting when it was actually true.
Why set it before hand? This is done for authenticity. Imagine you get a and you say its under so the hypothesis is valid. But someone can argue that is reached by P-Hacking since its so close to Also difference fields require different threshold levels due to the importance of the hypothesis if it is valid. Ex: A medical research hypothesis related to "A cure for cancer" may require the to be
3: Collect Data & Calculate a Test Statistic
You collect sample data and calculate a test statistic (like a -score, -score, or -statistic). This measures how far your sample results fall from what predicted.
4: Find the -value
The -value is the probability of getting your sample results (or more extreme) if the Null Hypothesis () were true.
- Small -value: The observed data is extremely unlikely under .
- Large -value: The observed data easily happens by random chance under .
5: Make a Decision
Compare your -value to your significance level ():
Since we use the null hypothesis is extremely unlikely as the evidence, We cannot ever Prove a hypothesis is correct using statistics. We can simply deduce that given the data, since the Null Hypothesis is extremely unlikely, the Alternative Hypothesis is supported by the evidence. But the actual reason we get the data might be different than the hypothesis.
Example: Imagine you have a hypothesis "Using an study app will help to score higher grades in exam" If your new study app resulted in higher test scores, it could be that:
- Your Hypothesis: The app actually helps students learn.
- Confounding Variable: The students using the app were just more motivated to begin with.
- The Hawthorn Effect: Students performed better simply because they knew they were part of an experiment. There are different ways to get even more evidence to deduce the hypothesis is true.
[ Hypothesis ] ──> [ Controlled Experiment ] ──> [ Replication ] ──> [ Consensus ]6. Errors in hypothesis Testing
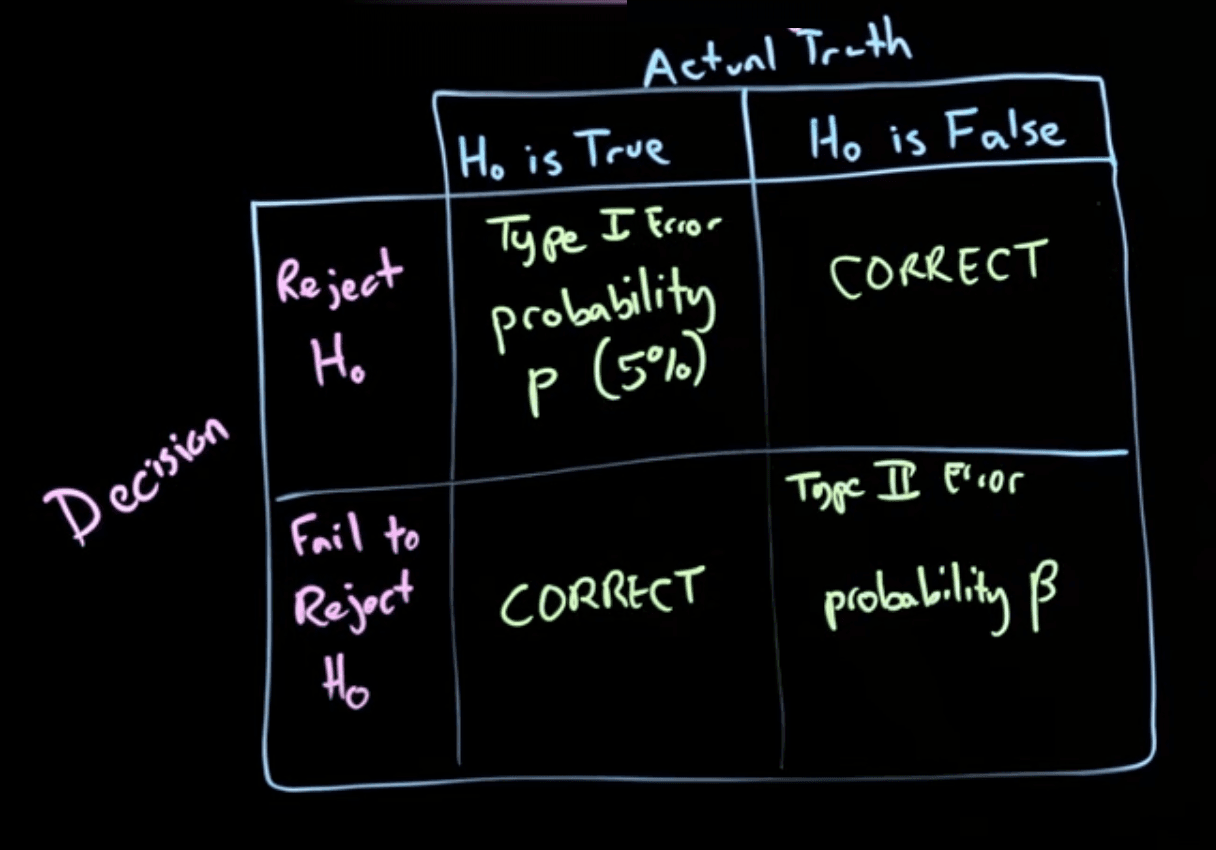
Since we are not certain the Null Hypothesis is wrong/correct, (i.e. Probability of Null hypothesis is not or ). There is a probability the null hypothesis will be true. In that case, the test fails with error.
Type I Error ()
Rejected Null Hypothesis, but Null hypothesis is true. (False Positive) This is the probability that our hypothesis is actually wrong.
The probability of Type I Error is , which is usually which is also known as the "Significance level".
Type II Error ()
Failed to reject Null hypothesis, but Null hypothesis is actually wrong. This is the probability that our hypothesis will be correct even though we deduced its not. There was a difference made but we think it didn't.
The probability of Type II Error is
The Statistical Power is known as (). This is the probability of correctly rejecting the null hypothesis when its actually wrong.
Relationship of and
To reduce both, the best option is to increase the sample size ().
Why Alpha and Beta Inverse in Hypothesis errors
| If Reality Is... | Test Metric | Meaning |
|---|---|---|
| There IS a real effect | Power () | You have an chance of correctly catching it. |
| There IS NO real effect | Alpha () | You have a chance of mistakenly calling a false alarm. |