Student's T Distribution
It is called "Student's" t-distribution because its creator, William Sealy Gosset, published his groundbreaking 1908 paper under the pen name "Student."
This is a continuous probability distribution that looks very similar to the standard normal (z) distribution. It is symmetric, bell-shaped, and centered at zero. However, it is shorter, flatter, and has heavier tails than a normal distribution.
This distribution is used to see how confident a sample mean to the population mean.
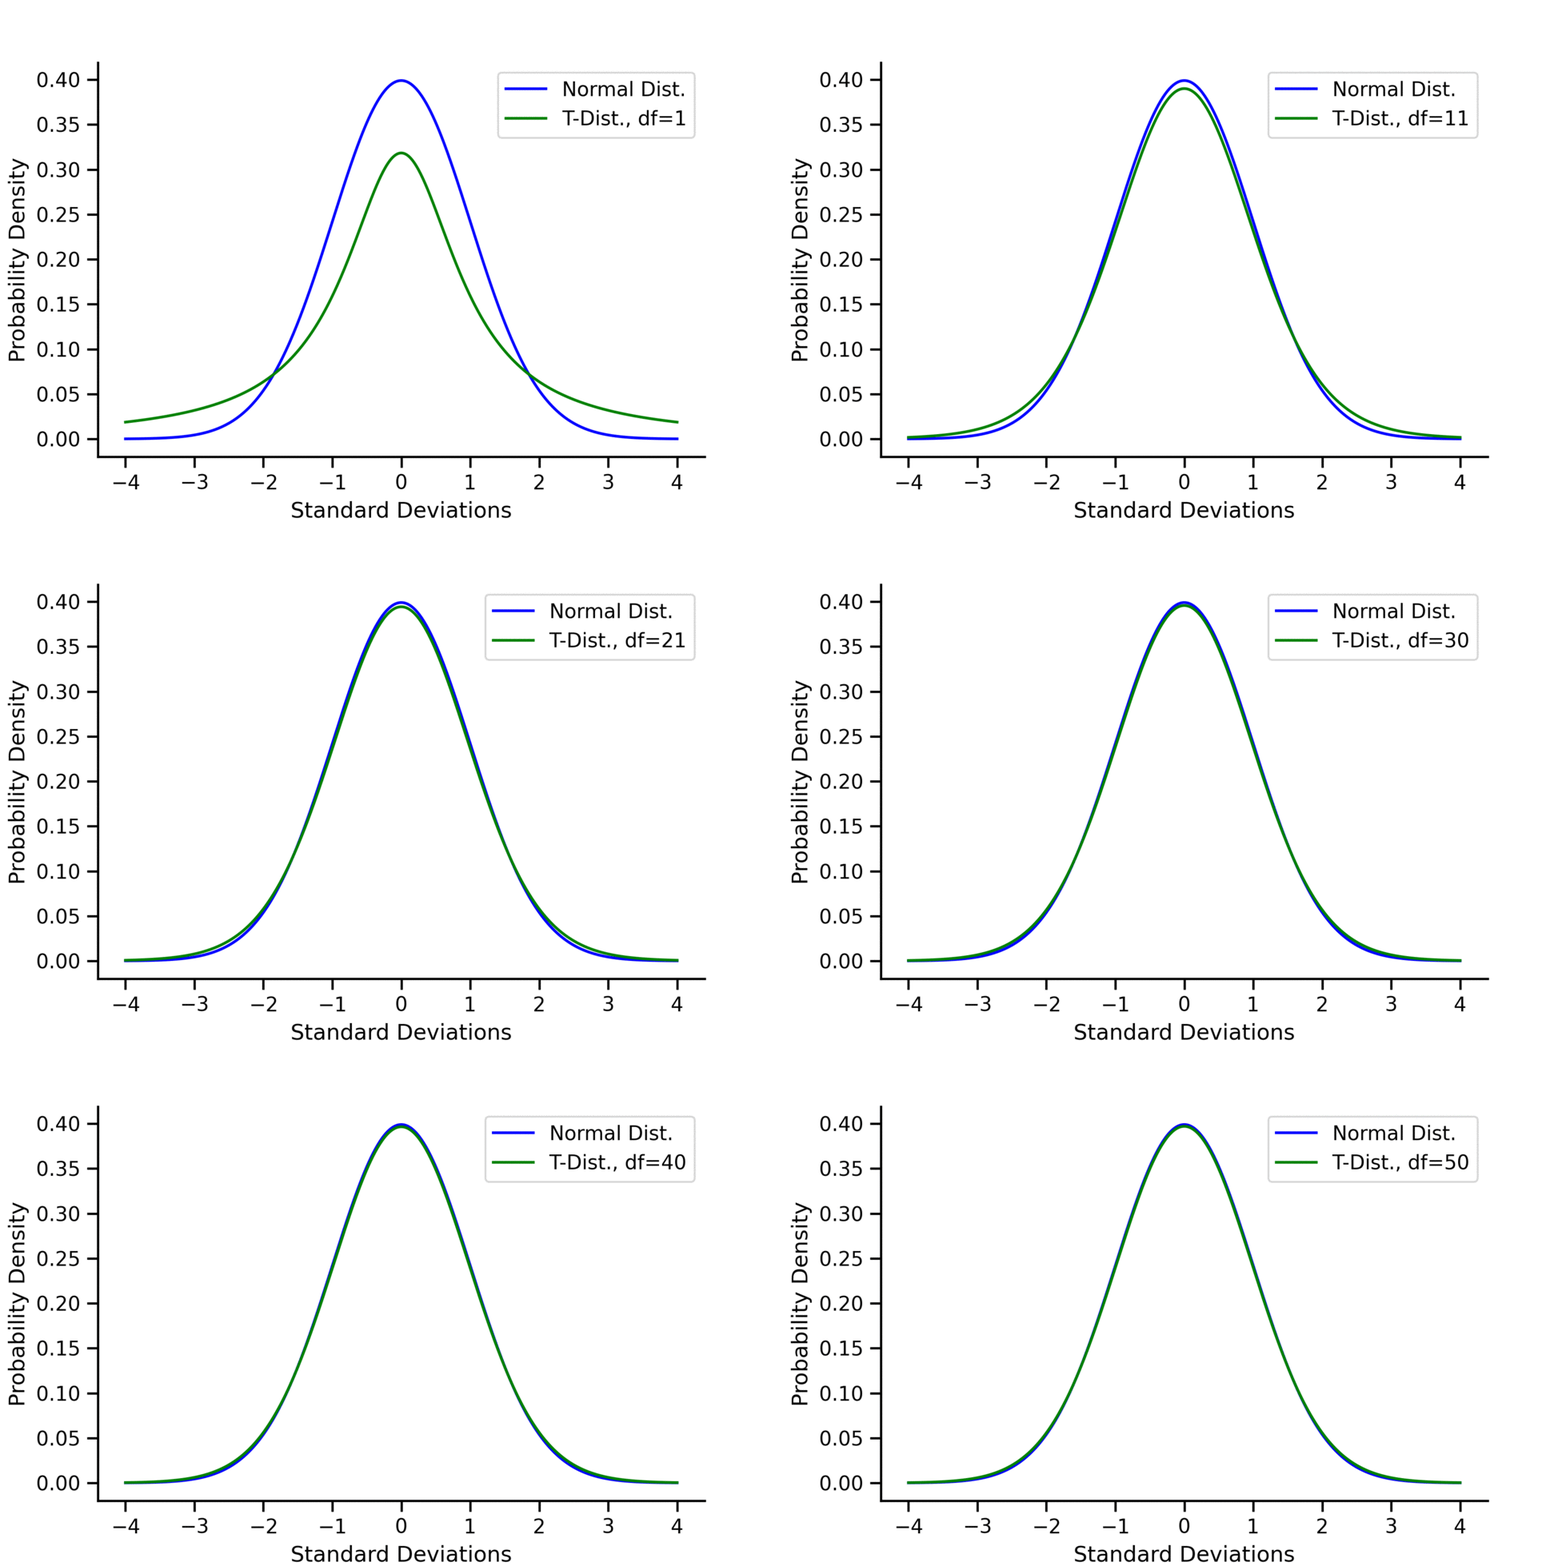
This distribution was invented to work with smaller sample sizes. When the sample is small, the normal distribution approximation adds more uncertainty. The student's T distribution corrects this uncertainty.
Core Properties
- Symmetry & Mean: Like the normal distribution, it is perfectly symmetric around a mean of .
- Heavier Tails: Because sample standard deviations fluctuate more than population standard deviations, extreme values are more common in a t-distribution.
- Degrees of Freedom (): The t-distribution isn't just one curve; it is a family of curves defined by its degrees of freedom, which typically equals your sample size minus one ().
- Asymptotic to the Normal: As your sample size (and thus degrees of freedom) increases, the t-distribution morph into the standard normal distribution. Usually, once sample sizes exceed , the differences are negligible.
T-Distribution vs. Normal (Z) Distribution
| Feature | Standard Normal (Z) Distribution | Student's T-Distribution |
|---|---|---|
| Population Variance () | Known | Unknown (estimated via sample ) |
| Sample Size Requirement | Typically large () | Useful for small samples () |
| Shape | Taller peak, thinner tails | Flatter peak, wider/heavier tails |
| Variability | Fixed (Variance = ) | Higher variance depending on |
Use-cases
- The population standard deviation is unknown.
- The sample size is small (traditionally ).
- statistic
This is very similar to how statistic is defined in normal distribution. Here since the true population mean and deviation is unknown, we use a hypothesized population mean and sample std. deviation.
Where:
- is your sample mean
- is the hypothesized population mean
- is your sample standard deviation
- is your sample size